Whilst programming is often portrayed as quite a serious endeavor (someone hacking into a bank, a security analyst saving the world, a financial quant spending 80 hours a week modelling interest rates etc…) there is alot of fun and inventiveness that can be had with it. One such example is solving puzzles through simulating potential outcomes to determine the probability of an event occurring.
The first person who comes to mind on this topic, at least for me, is David Robinson (@drob - https://twitter.com/drob). In addition to being a highly regarded data scientist, he’s authored / maintained a number of R packages and finds time to blog / screen cast examples of analytics and problem solving using the R programming language (https://www.youtube.com/channel/UCeiiqmVK07qhY-wvg3IZiZQ).
My first stab at programming came with R, and as such I learnt a lot from reading David’s posts and watching his videos, along with those from other members of the amazing R community. These days my programming tends to be focused on Python, but I still try and keep up with what’s going on in the R community, leading me to David’s recent post solving the Birthday Paradox using some of the neater tidyverse tooling!
The jist of the problem is calculating the probability two people in a room will share the same birthday, as the number of people in the room increases. In order to blow off a few Christmas coding cobwebs I decided to have a stab at this using python, both in a functional manner using python’s base data structures and also the commonly used Pandas library!
The R way!
So, first up is David’s code using the crossing, mutate and map functions from tidyr, dplyr and purrr respectively. However, I did feel inclined to change summarize back to the English spelling….
If you’re interested in the breakdown of the code his post has a brilliant explanation of each element (http://varianceexplained.org/r/birthday-problem/), but I’ve added a couple of comments below too.
library(tidyverse)

summarised <- crossing(people = seq(2, 50, 2), #Produce a cartesian df with people and trials
                       trial = 1:10000) %>%
  #Give each trial a number of randomly assigned birthdays
  mutate(birthday = map(people, ~ sample(365, ., replace = TRUE)),
  #Check if any birthdays match
         multiple = map_lgl(birthday, ~ any(duplicated(.)))) %>%
  #Group by number of people and calculate average across all trials
  group_by(people) %>%
  summarise(chance = mean(multiple))


head(summarised)
## # A tibble: 6 x 2
## people chance
## <dbl> <dbl>
## 1 2 0.0033
## 2 4 0.0175
## 3 6 0.0374
## 4 8 0.0689
## 5 10 0.118
## 6 12 0.169As you can see the above code leads to a dataframe with the simulated probability of a matching birthday based on the number of people in the room, which is what I’ve replicated below in two different ways.
Python part one - Native
For the first method I decided to stick mostly to python’s inbuilt data structures (list, tuples, etc), only using pandas to help aggregate and plot the data.
In order to stay away from dataframes I replied heavily on lists, with the first function taking an integer in order to provide a random sample on birthdays. This sample was then converted into a set (essentially a hashed list that can’t contain duplicates) in order to remove duplicates and a length check used to see if any items had been removed, giving me a binary output.
The second function then acted to replicate this function for both a number of iterations and a range of people, giving me a final list of tuples (essentially an immutable list) with the people, trial and result which I could feed into a pandas dataframe and aggregate, as shown below.
from random import choices
import seaborn as sns
import pandas as pd

def birthday_trial(people):
  """Function that takes an integer of people and determines if at least two have matching birthdays"""

    #Build list of random birthdays
    birthdays = choices(range(1, 366, 1), k = people)


    #Check for matches
    if len(set(birthdays)) == people:

        return 0

    else:

        return 1

def birthday_trailer(iterations, people):
  """Function to replicate previous function for required number of trails and groups of people """

    results = []

    #Iterate over list of people for set number of iterations
    for i in people:

        for j in range(0, iterations):

            #for each iteration record number of people, trial and result and append to results list
            result = tuple([i, j, birthday_trial(i)])

            results.append(result)

    return results

chances = birthday_trailer(1000, range(2, 51, 2))

chances_df = pd.DataFrame(chances, columns = ["People", "Trial", "Probability"])

chances_summary = chances_df.loc[:, ["People", "Probability"]].groupby("People").mean()

chances_summary.reset_index(inplace = True, drop = False)

chances_summary.head(6)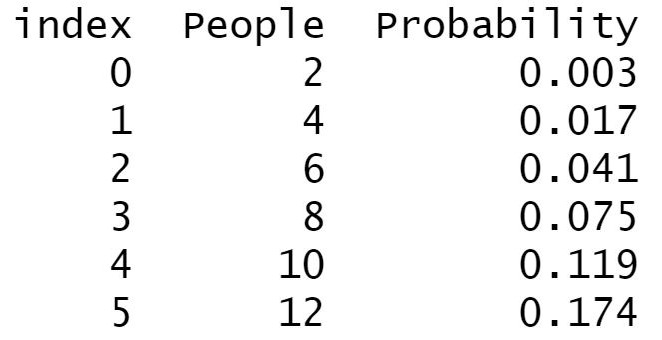
Python part two - Pandas
Once I’d completed the puzzle in (mostly) base data structures I decided to have a go using Pandas, a library developed for data analysis and manipulation.
For this method I first created a Cartesian product dataframe, similar to David using crossing, and then applied a couple of custom functions. The first gave each row a list a random birthdays based on the number of people allocated to that row. The second checked for any matching birthdays and returns a binary result. This dataframe could then be grouped by the number of people and an average taken, as in the previous two examples.
Finally I decided to make a simple line plot using the seaborn package to highlight the change in probability as the number of people increases.
import pandas as pd
import numpy as np
from random import choices
import seaborn as sns
from itertools import product

#Build the cartesian DF
pop_df = pd.DataFrame(list(product(range(2, 51, 2),
                                   range(0, 1000))), columns=['People', 'Trial'])

#Function to provide random birthdays
def birthday_lister(people):

    return choices(range(1, 366, 1), k = people)

#Function to check for matches
def match_checker(x):

    if len(set(x)) == len(x):

        return 0
    else:
        return 1

#Applying each function to the DF, each giving a new column
pop_df["Birthdays"] = pop_df["People"].apply(birthday_lister)

pop_df["Probability"] = pop_df["Birthdays"].apply(match_checker)


#Grouping, summarising and plotting of data
pop_df_summary = pop_df.loc[:, ["People", "Probability"]].groupby("People").mean()

pop_df_summary.reset_index(inplace = True, drop = False)

sns.lineplot(data=pop_df_summary, x='People',y='Probability').axhline(0.5, ls = "--")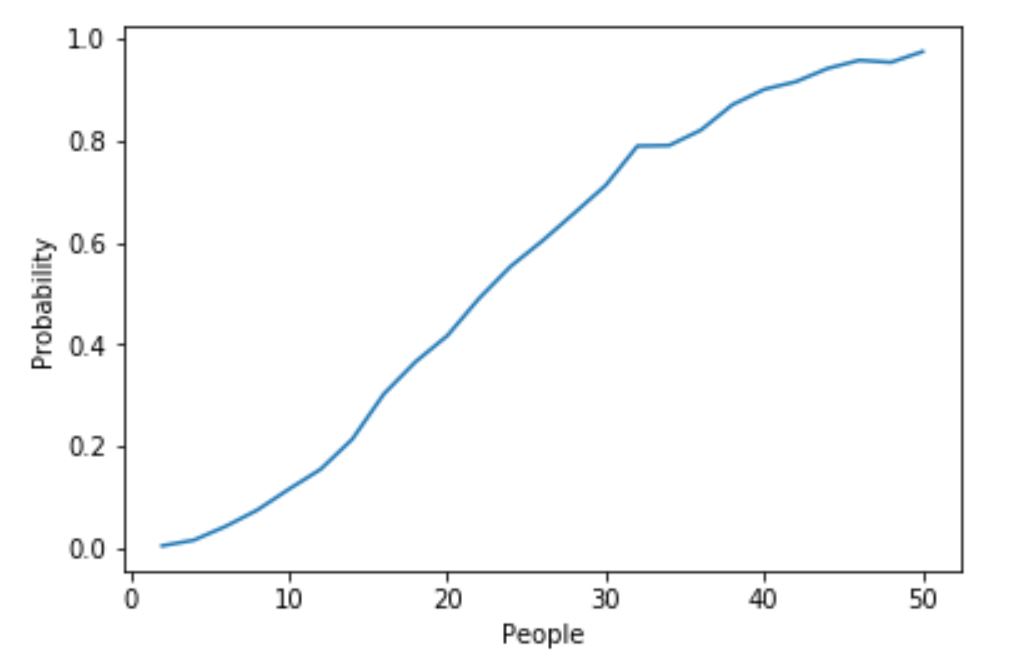
So there we have it, a couple of ways to repeat David’s interesting solution using python! What I haven’t covered here is the expansion into assessing the probability of n birthdays matching, though this could be achieved through small tweaks to the defined functions, IE checking the difference between set and sample length and using that integer as a score.
Once again I’d highly advise checking out David’s blog (http://varianceexplained.org/) for a few other interesting puzzles, it’s certainly given me a few good quick reads!